

Monitor and review site performance
A site's status provides overview of the current health of your website and it’s resource usage, as it relates to your WebOps Package subscription.
There are many places throughout the WebOps application where you can see the status of a site. Wherever site statuses are concerned, the following colour code is in use:
- Green Everything is performing as expected.
- Amber Your resource usage is nearing the limits of your Package.
- Red Your site is either down, performing slowly, or you've gone over the limits of your Package.
Site status is shown in your sites list, in the page header for a given site, and on the Site status page. Following are instructions for viewing detailed site status reports.
Select a site
On your Sites list page, you will see a listing of all your current sites along with a site status indicator icon for each.
Click "View site status"
Once you've selected a site, you will see a site status indicator in the top right of the screen. Click that link to view the Site status page
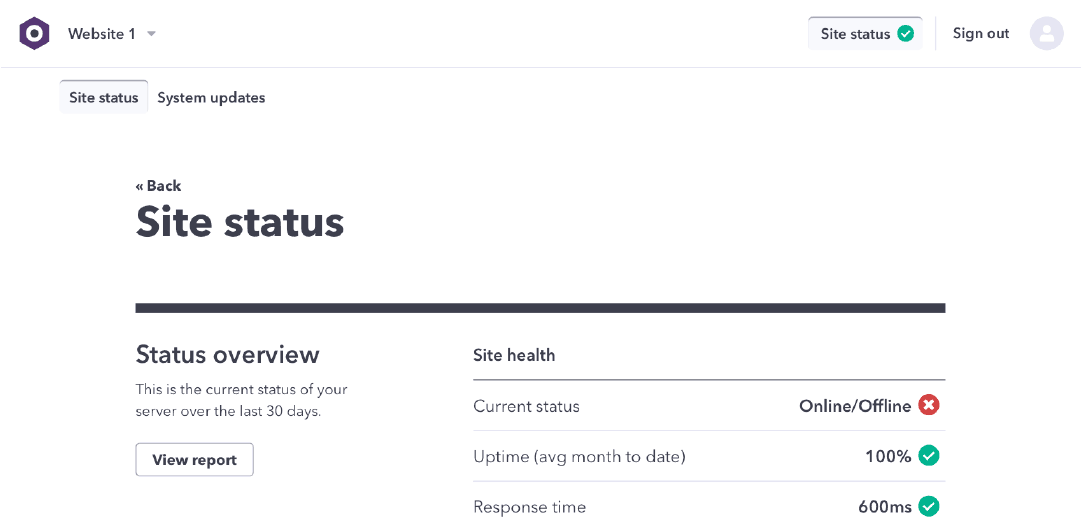
View site status reports, current and past
On the Site status page you're given an overview of the current status of your live website. Details about your site's health and your account usage are visible here.
- Whether the site is up or down
- The uptime in the current month
- The response time in the current month
- The disk usage in the current month (refreshed daily)
- The page views in the current month (refreshed daily)
To get a full report on the current month, click "View report" under Status overview.
To view past reports, click any month in the list of status reports below the the Status overview